Comment by kalid
15 years ago
I love this story because as Feynman puts it, there's a difference between knowing the name of something and really knowing it.
Since we're on the topic of light -- despite going to a great school and taking several physics courses, I suffered from a severe misconception until about a month ago. Maybe you have it too.
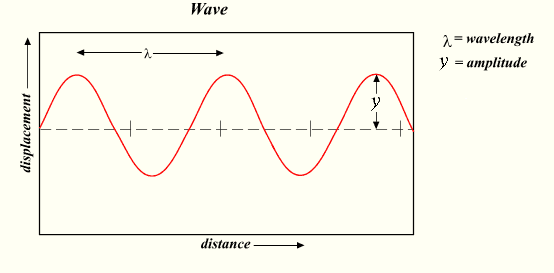
Think about a light wave. You might imagine a diagram like this:
http://betterexplained.com/wp-content/uploads/graphs/Wave.pn...
Yep, you've seen it a million times. Light is a wave and wiggles up and down... right?
Oh really? Do you think the fastest thing the universe travels in a zigzag pattern? Hey, why don't we beat the speed of light by moving on a straight line! Nobel prize time!
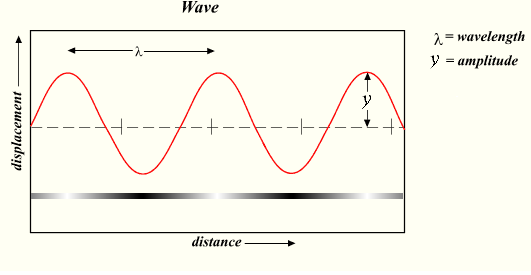
No, the y-axis is amplitude of the field. The graph is not a Family-circus dotted line following the particle's motion! A better diagram may be this:
http://betterexplained.com/wp-content/uploads/graphs/wave_am...
It's the intensity of the wave which is varying. But we memorize the "light is a wiggling wave" diagram and wind up with a severe misconception.
(Shameless plug: I blog at http://betterexplained.com and try to hammer away at the insights that have befuddled me.)
Personally I think the whole wave-particle business shouldn't be touched upon until the student understands that in reality those things are just complex vectors in a configuration space, not a little ball bouncing around. Equivalently you can think of them as outlined in Feynman's QED (which anyone interested in physics should read), as arrows. The word "wave" shouldn't ever be mentioned in introductory quantum mechanics.
Then once that's over, you explain to the students this: http://www.youtube.com/watch?v=_7OEzyEfzgg it's a duality of interpretation, not reality, we use wave mathematics for simplified calculations. Plus if you interpret it as a wave (as Feynman shows) you run into problems with experimental results not coming out as expected that a particle interpretation doesn't have problems with. (And for some reason I can't think of color in terms of waves, it makes much more sense if I think of it in terms of the energy of a photon with the brightness as a function of how many photons there are, which then ties back to a probability point of view where it's obvious that it's brighter where there's probabilistically more photons.)
http://lesswrong.com/lw/r5/the_quantum_physics_sequence/ remains for me the best introduction to thinking sanely about the subject without becoming confused from the get-go as you start talking about waves vs. particles.
But if you tell students "sometimes light looks like it's a wave and sometimes it looks like it's a particle" then they can parrot that back to you and sound smart. This is despite them not understanding the meaning of the words "looks like", "wave", "particle", or "sometimes".
Very informative, thank you!
Something I've been mulling over for awhile now is... what does it mean to represent a color with numbers?
That is, every pixel on our monitor is RGB 0 through 255. But what about in physics? Well, "color" is a photon whose wavelength falls between 400nm (short wavelength; intense energy; "ultra"-violet; and violet = blueish; therefore 400nm = "the blue side" of the EM spectrum; this is how I remember that) and 700nm (red).
So on one hand, we have three numbers, R, G, and B; on the other hand, we have a single number, wavelength.
Obviously, the answer is that R, G, and B have some significance to the human eye. But wait a minute; every human eye is different. Some people are color blind, for example. So these RGB values can't really claim to have a physical basis.
Now, what is the meaning of a combination of colors? Let's say, RGB(50,50,0) + RGB(0,50,50). Is the result RGB(50,100,50), like you'd expect?
I think not.
RGB is not a linear space. In the same way you can't add two points on the Richter scale, you can't add two RGB values and get a meaningful result, I think.
So then we have something called "sRGB", which claims to be a linear space. But really, sRGB is merely RGB space "warped" to conform to the gamma curves of standard monitors. It still has no physical meaning, as far as I can see.
I believe perhaps the correct answer is...
When a light source emits light (for example an incandescent light bulb), it's really emitting many different wavelengths along the EM spectrum. The final color is the result of our eyes combining those wavelengths.
So, to add two colors A and B, we must first convert them both from RGB back into the EM spectrum (think of it like a histogram, where the X axis is wavelength from 400nm to 700nm, and the Y axis is the intensity of each wavelength); then add the two spectrums; then finally convert the resulting spectrum back to RGB.
Will this produce the same results as (A + B)? I don't think so, but I haven't tried it.
Food for thought...
EM radiation can have any wavelength. Color is the visible spectrum in which our retinal cones and rods respond when EM is shone upon them (actually, they cease responding, but that's another matter). We have 3 kinds of cone cell receptors sensitive to different parts of the visible spectrum. Color is the perception generated further down in our brain from the combination of these incoming signals. Screens were designed to be visible, that's why it makes sense to have 3 colors of LEDs. Light wave frequencies do not add up, i.e. you can't add 2 green beams to create an ultraviolet.
My point was that you can't add two RGB values and expect to get a meaningful physical result --- you can't multiply them either, as far as I know.
This has vast implications for computer graphics. Video games, for example.
"Light wave frequencies do not add up, i.e. you can't add 2 green beams to create an ultraviolet."
The light wave frequencies do add up --- if you add 2 "green" beams, then you get a more intensely bright green beam. The hue changes only slightly.
10 replies →
First off, thank you for pointing this out. I occasionally teach introductory physics and I had never realized that people could interpret the graph in that manner. I'll try to make nip this in the bud when I present this material in the future.
Your alternate graph, however, shows another common misconception that is matched in your text. Specifically, the amplitude of the wave varies, but the intensity does NOT. The amplitude being graphed can be though of as the strength of the electric field pointing.... how about to the north? Then, when the amplitude is negative, all that's happening is that the field is point to the south, instead of the north. The intensity of the light is the energy contained within the electromagnetic field, which is independent of which direction the field is point. Thus, where you have dark spots in the graph where the amplitude goes negative, the intensity of the light is just as strong as it was at the peaks.
The obvious next question is what happens when the amplitude is zero? Well, the changing electric field produces a magnetic field. This magnetic field reaches its maximum value where the electric field goes to zero and goes to zero itself at the minima and maxima of the electric field's amplitude. Thus, the total energy electromagnetic energy, and, therefore, the intensity of the light, is constant across the whole graph.
That's why I'm cautious about using your proposed diagram. I've known many students with the misconception that light alternates between bright and dark as it travels and that lines up exactly with what you've drawn.
Great point! That's something I didn't make clear enough in the diagram, and a 2nd misconception I had until a month ago too :).
Yes, exactly as you say, the total energy is the same but the orientation and amplitude of the field differs. I think the trouble is showing another dimension without resorting to the y-axis which is too easily confused with a path to travel (especially a sine wave, which is usually shown in the context of "height on a circle" or somesuch).
Red and blue colors may be better -- bright red to bright blue, showing which way the field is pointing at that time. Black and white are too easily confused with dim and bright (and a light wave never goes "off").
The original diagrams were made years ago and I should update the colors. Definitely appreciate the feedback!
You do indeed hammer away and long may you continue! Your site is very helpful resource for students and anyone with kids.