Comment by westurner
4 months ago
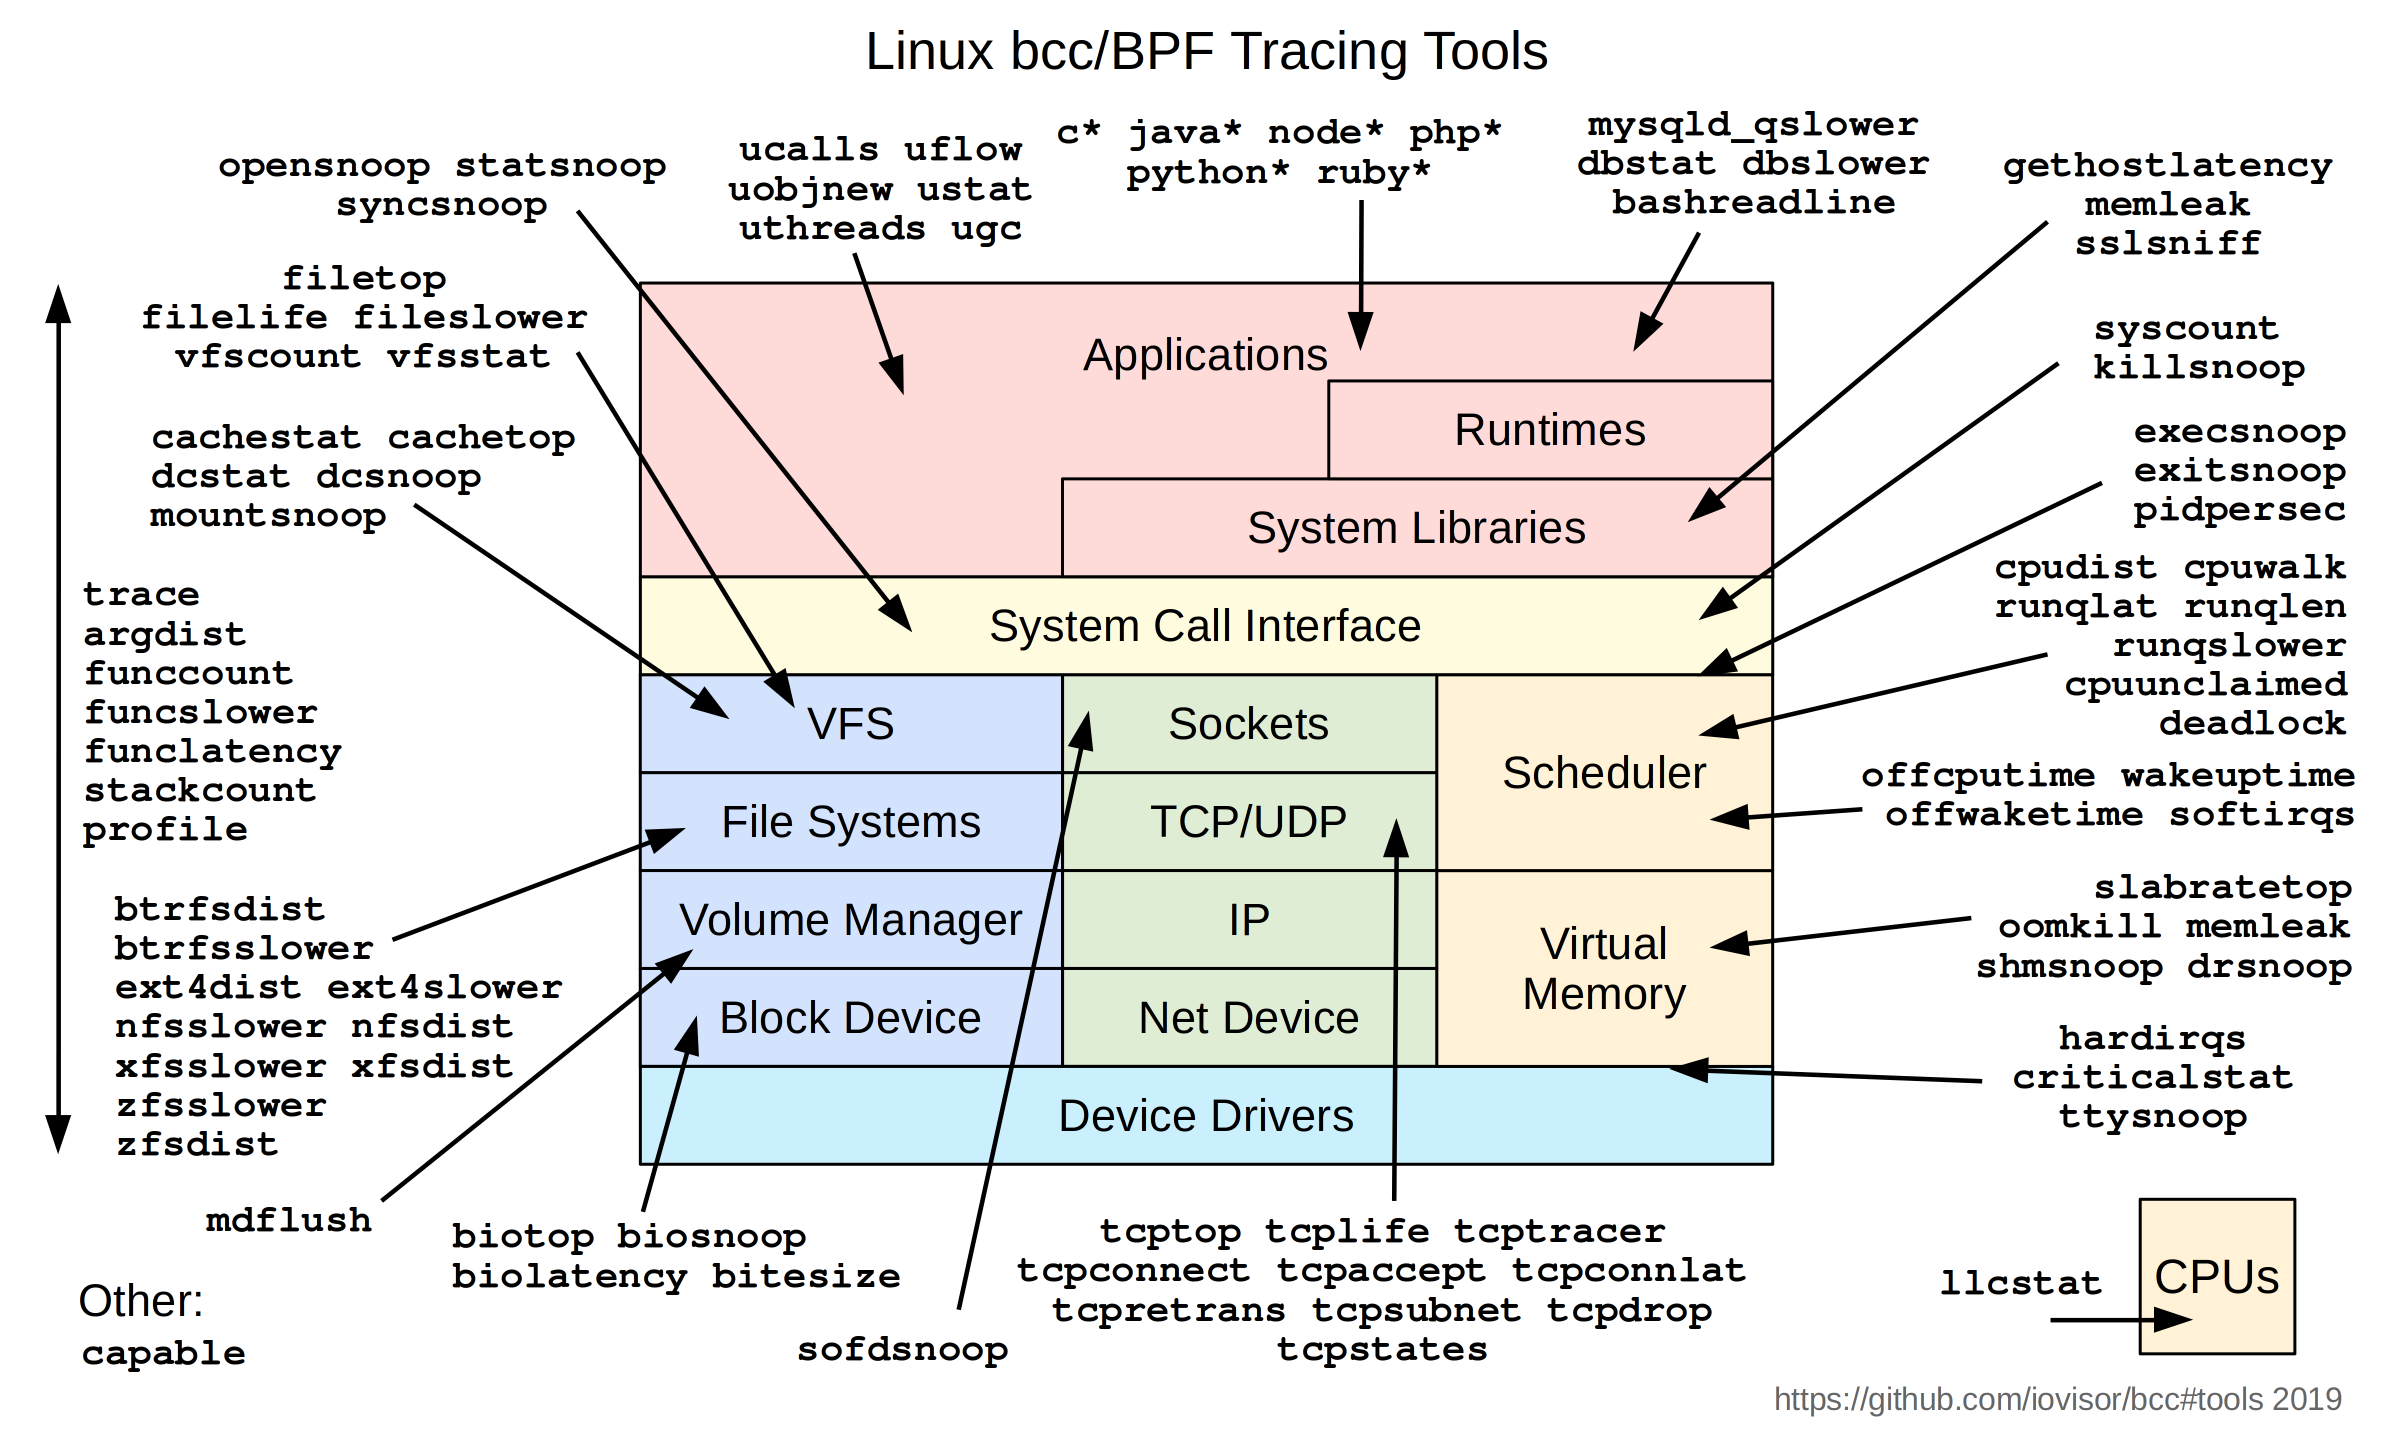
np. there's a diagram, "Linux bcc/BPF tracing tools" [-1] in the bcc readme [0] that's also in [1] which explains ebpf and bcc and bpftrace.
filetop, dirtop, and vfsstat use bpf to trace the VFS layer. [4]
[-1] "Linux bcc/BPF tracing tools" https://www.brendangregg.com/BPF/bcc_tracing_tools_early2019...
[0] iovisor/bcc: https://github.com/iovisor/bcc
[1] "Linux Extended BPF (eBPF) Tracing Tools", Dtrace book: https://www.brendangregg.com/ebpf.html
If running an AI agent in a container --- with devcontainers and e.g. vscode,
Good container policy prevents granting a container the CAP_SYS_ADMIN capability; the least-privileges thing to do is to grant limited capabilities to the container like CAP_BPF and (CAP_PERFMON, CAP_NET_RAW, CAP_SYS_PTRACE) [,3].
[3] https://medium.com/@techdevguides/using-bpftrace-with-limite...
[4] bpfcc-tools manpages: https://manpages.debian.org/unstable/bpfcc-tools/index.html
though ripgrep wins, vscode fails at monitoring large workspaces due to inotify limits too; so some way to parse fs events from bcc and libdtrace with python would be great
prompt 1: Create a python project named idk dbpftrace with a pyproject.toml and a README and sphinx /docs, with bcc and python-dtrace as dependencies to, then in dbpftrace/,
parse pid and descendents' fs syscall events from bcc (ebpf) or python-dtrace (dtrace), depending on which os we're running
Edit:
Prompt 1B: Create a Go package named dbpftrace with a README and docs,
parse pid and descendents' fs syscall events from bpftrace or dtrace stdout, depending on which os we're running
Prompt 1C: Create a Go package named dbpftrace with a README and docs, then create a cli utility named dbpftrace to:
parse pid and descendents' fs syscall events (like bpftrace) using libbpfgo and godtrace
Use either (cilium/ebpf or libbpfgo or gobpf) or (godtrace or (CGO or FFI) bindings to libdtrace) depending on which OS, by default
cilium/ebpf: https://github.com/cilium/ebpf
aquasecurity/libbpfgo https://github.com/aquasecurity/libbpfgo
iovisor/gobpf w/ bcc: https://github.com/iovisor/gobpf
chzyer/godtrace: https://github.com/chzyer/godtrace
oracle/dtrace-utils/tree/devel/libdtrace: https://github.com/oracle/dtrace-utils/tree/devel/libdtrace
From > awesome-ebpf > Kernel docs, examples, Go libraries:deemkeen
4 months ago
westurner
4 months ago
Thanks for the thoughtful pointers — super helpful.
Where diffwatch is today: it’s a portable directory watcher (fsnotify → inotify/FSEvents/ReadDirectoryChangesW) that coalesces events and renders live unified diffs in a tiny TUI.
What I’m planning based on your suggestions (and others here):
1. Two-tier design
Default (no admin): keep the current directory-watch mode for quick, portable use.
Power mode (attach): diffwatch attach --pid <PID> | --cmd "<…>" to trace a process and its children and feed any touched paths into the same diff UI.
2. Per-OS backends for “attach”
Linux: eBPF/bpftrace when available; fallback to strace -ff -e trace=file for zero extra deps.
macOS: opensnoop / fs_usage (DTrace-based).
Windows: ETW (Kernel File provider) via a tiny helper (e.g., KrabsETW) that streams JSON events.
3. Admin rights caveat
macOS (DTrace) and Windows (ETW kernel) typically require admin. I’ll keep the default dir-watch mode as the “no-admin” path, and document the elevated-rights requirement clearly for “attach”.
4. Normalized event stream
All backends emit a common JSON line: {"ts": "...", "pid": 1234, "op": "create|write|rename|unlink|close", "path": "..."} Then a short stability window (debounce + retry on transient ENOENT) before reading to diff.
5. Scalability & ergonomics
Handle editor/atomic-save tempfiles gracefully.
Respect .gitignore and add --exclude/--include globs.
Guardrails for watch count limits; skip non-regular files; optional --record (NDJSON) and --save-patch.
6. Containers / agents
Nice follow-on: diffwatch attach --cmd ... inside a container (or attach by PID in the container namespace) to confine the blast radius for agent runs.
Ask: I’d love help and pointers to minimal tracer scripts:
A small bpftrace/DTrace snippet that reliably captures opens/writes/renames for a PID(+children).
A tiny Windows ETW consumer example focused on File I/O, filtered by PID, emitting JSON.
Repo: https://github.com/deemkeen/diffwatch I’ll open issues for:
“Attach mode” backends (Linux/macOS/Windows)
.gitignore/globs
Event coalescing + transient ENOENT handling
JSON recording / patch export
If you or anyone wants to collaborate, I’ll tag them good first issue / help wanted and am happy to review PRs quickly. Thanks again for the nudge to go beyond plain FS events — the PID/container “attach” mode should make agent debugging much more robust.
Np. Distributed tracing tools for containers already do this but none have a --diff feature for logging what changed in changed files.
Does this command also track renames?
Isn't it just a list of syscalls instead of vfs:*?
Actually, re: Dtrace on MacOS with SIP and apparently without sufficient symbols installed to trace kernel syscalls these days: https://jade.fyi/blog/misadventures-in-dtrace/ :
> My advice, and what I actually did, is to put macOS in a UTM.app VM with nothing of value in it, disable SIP in the VM, and do all further testing in there.
> Once inside a VM with SIP disabled (or with dtrace enabled as a fine-grained policy), DTrace works. dtruss gives some output like the following:
FWIU it is possible to trace Linux containers on Mac OS with e.g. cilium, only if the Linux containers are hosted in a Linux VM.