Comment by littlestymaar
3 months ago
> Housing, again is easy to disprove for the relevant timeframe - price to income ratios were not much higher
Yet another unsubstantiated claim that is wrong:
https://www.schroders.com/en-gb/uk/individual/insights/what-...
https://fred.stlouisfed.org/graph/?g=n9xI
https://www.igedd.developpement-durable.gouv.fr/IMG/jpg/prix...
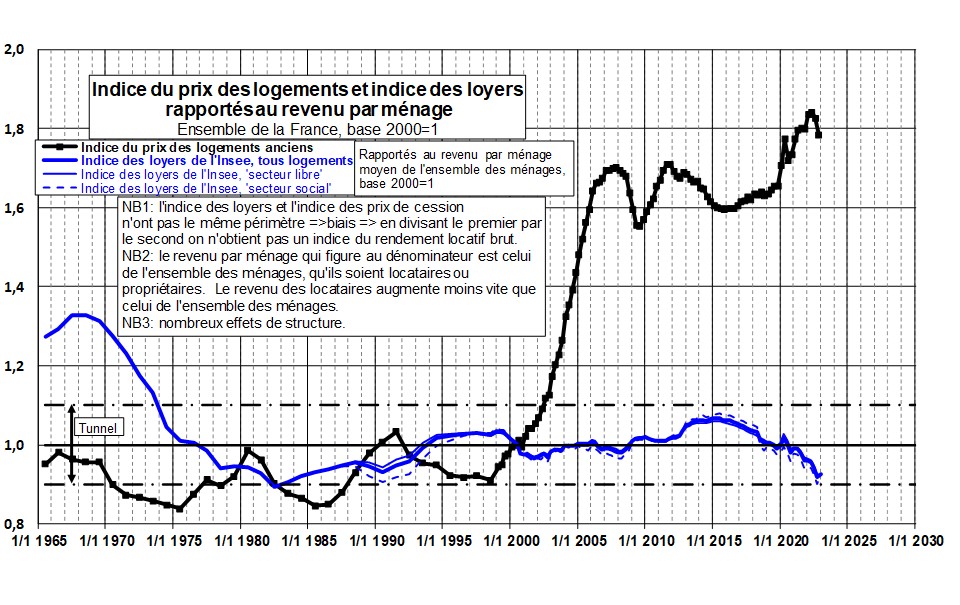
https://www.ceicdata.com/en/australia/house-price-index-seas...
The US are kind of an outlier because price recessed between the financial crisis and Covid, but it has then caught up with the broader western trend. And keep in mind that the “price to average income” ratio doesn't tell you anything about the situation of the lowest incomes, which have declined relatively to the mean.
> The size of the houses was steadily increasing too
Like with mobile phones or cars, a house twice as good and twice as expensive is still twice as expensive.
> indicating increased demand for bigger houses due to increased incomes and living standards
Unsubstantiated claim, and also wrongly assuming homogeneous growth of the house size (if 10% of your housing supply double in size, while the other stay still, the average size increase by more than 10% but this tells you nothing about the housing stock as a whole).
> But the vibes among recent college grads wanting a house in SF specifically is certainly pretty gloomy.
Not just SF, and not just recent college grads, that's the thing. Even social classes that used to be preserved from the housing cost increase are now affected as well.
Here's the long term trend, of course https://www.longtermtrends.net/home-price-median-annual-inco...
Ratio was very similar in 1965 and 1995, for example and not much higher than previously after the housing bubble. So, not much to do with deregulation and welfare state in the 80ies or whatever.
Then this has median house size over time https://www.census.gov/content/dam/Census/programs-surveys/a...
Median house is not affected by average issues you indicate, and it increases steadily over time including when price to income is falling or staying low.
Also, since housing costs for most people are substantially affected by interest rates, the pre covid period would look even better.
Where is the data for the poorest, and what does the poorest mean, 1%, 10%, 0.1%?
Of course, housing prices, especially local, are mostly due to underbuilding, and underbuilding is to a large extent caused by zoning, and environmental/etc review. Nothing to do with "current system", unless by current system you mean too much government and too much democratic input over other people's property :)
Oh btw here's hard to use long term doc.https://www.bls.gov/opub/100-years-of-u-s-consumer-spending....
Spending on housing was 29.5% in 1960, 30.8% in 1973, 32.8% in 2001, as far as it goes.
It's funny how you always escape data by cherry picking other data instead of addressing the data you loudly reclaimed.
> and not much higher than previously after the housing bubble
Except that you cannot discount the “bubbles” when they represent a significant fraction of the recent period. And as mentioned before, the relative housing cost decline during the 2010s is a US peculiarity that didn't happen elsewhere in the West.
> Median house is not affected by average issues you indicate, and it increases steadily over time including when price to income is falling or staying low.
That's a nice counterpoint to your original argument, thank you.
> Of course, housing prices, especially local, are mostly due to underbuilding, and underbuilding is to a large extent caused by zoning, and environmental/etc review
That's a comfortable myth. I wonder why housing cost hasn't fallen to zero in Detroit as the “law of supply and demand” say it should have.
> and too much democratic input
“Market gud, democracy bad and I am very smart”, I see …
(Also, if you scroll up a little, you'll see that my argument wasn't just about housing but more globally about basic necessities like housing and healthcare becoming less accessible, negating the apparent “standard of living” improvement. And while the US has been an exception in the 2010 with respect to housing costs, it unfortunately also has been an exception in terms of healthcare cost).
I was only talking about the US. I am not familiar with European problems, my outside view is if Europe were more like the US perhaps it wouldn't be poor compared to the US, but I don't know for sure.
In the US, you gave me a short term data and I just gave you a longer term view than gives a fuller picture, as you've tried to discount my taxes data before (even though that data included relevant tax reform years).
Moreover I gave you BLS consumption data. Spending on housing went from 29 to 32% from 1960 to 2000, with no obvious changes in trend. While the median house is 1.5-2x big and quality and safety regulations became more strict. Oh and household sizes decreased iirc. Housing may be becoming less accessible since covid, sure. Any 1980ies welfare state etc changes don't have much to do with that.
Then, Detroit in fact has a massive number of abandoned houses, so yes prices did effectively go to zero. Presumably if they could be sold to anyone they would be, but they are not worth owning https://detroitmi.gov/news/deputy-mayor-detroit-land-bank-au...
Thanks for providing me with this great argument for supply and demand, I will use it in future ;)
"Market gud, democracy bad and I am very smart”, I see"
Vibes, vibes. There's tons of data on this, from micro data to between city comparison. There's even more data on costs, delays and cancellations for larger projects due to reviews and lawsuits. There's a reason California is currently trying to preempt local zoning to encourage more housing, and municipalities are trying to find loopholes around it. That is not data but you can just go on nextdoor and find a bunch of people outraged that developers upzoning their neighbor lot dared to remove 2 trees without a public hearing. If I was choosing between this and Robert Moses with no compromise possible, the latter is definitely a lesser evil than democratic input, and I say it as someone who doesn't usually like the government.
On healthcare you can check this: https://randomcriticalanalysis.com/why-conventional-wisdom-o...
Which incidentally also dispelled my previous belief that it was doctor salaries, that is while closer to reality than blaming the insurance (that is a small fraction of the difference between the US and other countries, provider costs being the main issue and insurance being a sin eater), is still mostly wrong. Frankly at this point I'm half supportive of Medicare for all. It won't improve much but at least people will have stfu about evil corporations in this area.
Americans are just very rich. Hence as percentage spent on necessities decreases, percentage spent on other things must increase. Bigger houses too, a little bit; however labor intensive industries with infinite extra spending potential like healthcare, education are "the best positioned" to suck up the increased disposable incomes
6 replies →